144Seattle homes went pending last week▲ 13.4% vs. prior week
7,726King County homes for sale in October▲ 28.7% vs. Oct 2025
22.7%of King County listings went pending in October31.4% a year ago
98%of list price: where King County houses go pendingCondos: 97% · marker = full asking
The lead story
How does the Seattle market compare with a normal year?
It is slower than normal for every home type. In October 2026, Seattle and Eastside houses, townhomes and condos all had more supply, sold for a lower share of list price and took longer to sell than in a typical October over the last 10 years. Seattle houses are closest to normal on supply and days on market.
All 6 home types at a glance
Months of supply: October vs. 10-year averageEvery segment has more supply than a typical October. Higher means more choice for buyers.See the numbers
Segment
Oct 2026
10-year Oct avg
Seattle houses
3.1
1.6
Seattle townhomes
6.9
2.7
Seattle condos
9.8
3.6
Eastside houses
4.7
1.6
Eastside townhomes
9.8
1.9
Eastside condos
6.3
2.1
Sale price % of list priceEvery segment sold for a lower share of list price than usual. Final listing only; canceled and relisted history not counted.See the numbers
Segment
Oct 2026
10-year Oct avg
Seattle houses
99.6%
101.2%
Seattle townhomes
98.9%
99.8%
Seattle condos
97.2%
99.3%
Eastside houses
97.0%
100.5%
Eastside townhomes
98.1%
99.9%
Eastside condos
96.5%
99.1%
Days on market: October vs. 10-year averageHomes are taking longer to sell, most of all condos.See the numbers
Segment
Oct 2026
10-year Oct avg
Seattle houses
23
20
Seattle townhomes
35
28
Seattle condos
50
36
Eastside houses
34
26
Eastside townhomes
35
25
Eastside condos
55
30
Month by month: pick a home type
The gray line is what each month normally looks like, averaged over the last 10 years. The dots are what actually happened in each of the last 12 months. The large dot is October 2026.
Seattle
Eastside
Jan to Oct 2026Nov to Dec 202510-year average for that month (normal)
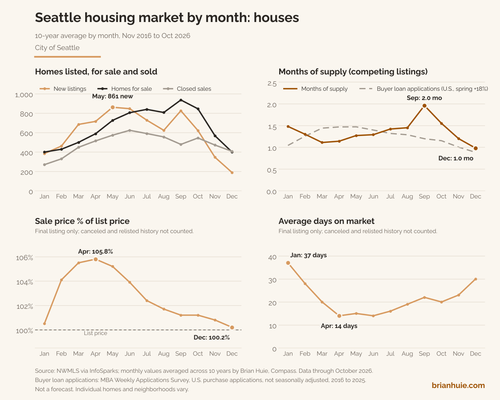
Seattle houses: October 2026 vs. a normal year
Months of supply3.1 months of supply vs. 1.6 in a normal October: more choice for buyers.See the numbers
Month
Last 12 months
10-year average
Jan 2026
3.3
1.5
Feb 2026
2.3
1.3
Mar 2026
1.8
1.1
Apr 2026
1.9
1.1
May 2026
2.1
1.3
Jun 2026
2.0
1.3
Jul 2026
2.6
1.4
Aug 2026
3.2
1.5
Sep 2026
4.2
2.0
Oct 2026
3.1
1.6
Nov 2025
2.5
1.2
Dec 2025
1.9
1.0
Sale price % of list priceSelling at 99.6% of list price vs. 101.2% normally: below normal.See the numbers
Month
Last 12 months
10-year average
Jan 2026
98.8%
100.5%
Feb 2026
101.4%
104.1%
Mar 2026
102.6%
105.5%
Apr 2026
102.3%
105.8%
May 2026
101.9%
105.2%
Jun 2026
100.8%
103.9%
Jul 2026
100.6%
102.4%
Aug 2026
100.0%
101.7%
Sep 2026
99.9%
101.2%
Oct 2026
99.6%
101.2%
Nov 2025
99.4%
100.8%
Dec 2025
99.0%
100.2%
Days on market23 days on market vs. 20 normally: homes are selling slower.See the numbers
Month
Last 12 months
10-year average
Jan 2026
52
37
Feb 2026
29
28
Mar 2026
21
20
Apr 2026
17
14
May 2026
18
15
Jun 2026
19
14
Jul 2026
20
16
Aug 2026
25
19
Sep 2026
24
22
Oct 2026
23
20
Nov 2025
27
23
Dec 2025
37
30
Homes for sale1,281 homes for sale vs. 845 in a normal October.See the numbers
Month
Last 12 months
10-year average
Jan 2026
675
399
Feb 2026
763
428
Mar 2026
804
499
Apr 2026
980
588
May 2026
1,086
726
Jun 2026
1,113
805
Jul 2026
1,177
839
Aug 2026
1,203
807
Sep 2026
1,394
936
Oct 2026
1,281
845
Nov 2025
826
567
Dec 2025
600
399
New listings622 new listings vs. 621 normally.See the numbers
Month
Last 12 months
10-year average
Jan 2026
463
383
Feb 2026
579
461
Mar 2026
698
684
Apr 2026
836
715
May 2026
832
861
Jun 2026
756
846
Jul 2026
712
728
Aug 2026
585
623
Sep 2026
941
825
Oct 2026
622
621
Nov 2025
276
345
Dec 2025
152
188
Closed sales418 closed sales vs. 544 normally.See the numbers
Month
Last 12 months
10-year average
Jan 2026
206
269
Feb 2026
328
329
Mar 2026
446
448
Apr 2026
507
514
May 2026
515
573
Jun 2026
547
623
Jul 2026
453
590
Aug 2026
378
555
Sep 2026
334
478
Oct 2026
418
544
Nov 2025
333
471
Dec 2025
319
406
Seattle townhomes: October 2026 vs. a normal year
Months of supply6.9 months of supply vs. 2.7 in a normal October: more choice for buyers.See the numbers
Month
Last 12 months
10-year average
Jan 2026
5.3
1.9
Feb 2026
3.9
1.4
Mar 2026
3.1
1.3
Apr 2026
4.2
1.7
May 2026
4.3
1.7
Jun 2026
4.3
2.0
Jul 2026
5.0
2.2
Aug 2026
6.3
2.2
Sep 2026
7.1
2.7
Oct 2026
6.9
2.7
Nov 2025
5.1
2.0
Dec 2025
3.2
1.5
Sale price % of list priceSelling at 98.9% of list price vs. 99.8% normally: below normal.See the numbers
Month
Last 12 months
10-year average
Jan 2026
99.0%
99.7%
Feb 2026
99.4%
101.1%
Mar 2026
99.2%
101.4%
Apr 2026
99.2%
101.7%
May 2026
99.4%
101.4%
Jun 2026
99.2%
101.0%
Jul 2026
99.0%
100.3%
Aug 2026
98.5%
100.0%
Sep 2026
98.9%
99.9%
Oct 2026
98.9%
99.8%
Nov 2025
98.9%
99.8%
Dec 2025
99.0%
99.5%
Days on market35 days on market vs. 28 normally: homes are selling slower.See the numbers
Month
Last 12 months
10-year average
Jan 2026
65
38
Feb 2026
47
33
Mar 2026
44
28
Apr 2026
34
21
May 2026
31
21
Jun 2026
28
20
Jul 2026
32
21
Aug 2026
44
26
Sep 2026
43
27
Oct 2026
35
28
Nov 2025
41
29
Dec 2025
45
32
Homes for sale693 homes for sale vs. 411 in a normal October.See the numbers
Month
Last 12 months
10-year average
Jan 2026
560
239
Feb 2026
571
243
Mar 2026
640
269
Apr 2026
692
301
May 2026
720
331
Jun 2026
690
371
Jul 2026
670
376
Aug 2026
654
371
Sep 2026
670
409
Oct 2026
693
411
Nov 2025
633
307
Dec 2025
484
234
New listings282 new listings vs. 236 normally.See the numbers
Month
Last 12 months
10-year average
Jan 2026
323
225
Feb 2026
284
219
Mar 2026
350
252
Apr 2026
392
256
May 2026
338
278
Jun 2026
303
276
Jul 2026
294
237
Aug 2026
229
219
Sep 2026
293
275
Oct 2026
282
236
Nov 2025
203
159
Dec 2025
108
111
Closed sales100 closed sales vs. 152 normally.See the numbers
Month
Last 12 months
10-year average
Jan 2026
105
127
Feb 2026
148
170
Mar 2026
206
206
Apr 2026
165
179
May 2026
168
194
Jun 2026
159
185
Jul 2026
133
175
Aug 2026
104
166
Sep 2026
94
153
Oct 2026
100
152
Nov 2025
125
153
Dec 2025
153
158
Seattle condos: October 2026 vs. a normal year
Months of supply9.8 months of supply vs. 3.6 in a normal October: more choice for buyers.See the numbers
Month
Last 12 months
10-year average
Jan 2026
6.2
3.1
Feb 2026
5.3
2.4
Mar 2026
5.4
2.3
Apr 2026
5.7
2.5
May 2026
5.9
2.6
Jun 2026
6.3
2.8
Jul 2026
7.1
3.1
Aug 2026
9.0
3.2
Sep 2026
9.0
3.7
Oct 2026
9.8
3.6
Nov 2025
6.2
2.8
Dec 2025
3.7
2.2
Sale price % of list priceSelling at 97.2% of list price vs. 99.3% normally: below normal.See the numbers
Month
Last 12 months
10-year average
Jan 2026
97.9%
99.1%
Feb 2026
98.3%
100.6%
Mar 2026
98.8%
100.8%
Apr 2026
98.5%
101.3%
May 2026
98.6%
101.0%
Jun 2026
98.0%
100.5%
Jul 2026
97.6%
99.9%
Aug 2026
97.3%
99.6%
Sep 2026
96.9%
99.4%
Oct 2026
97.2%
99.3%
Nov 2025
98.1%
99.3%
Dec 2025
97.6%
99.1%
Days on market50 days on market vs. 36 normally: homes are selling slower.See the numbers
Month
Last 12 months
10-year average
Jan 2026
70
55
Feb 2026
64
44
Mar 2026
51
37
Apr 2026
49
29
May 2026
38
28
Jun 2026
42
27
Jul 2026
46
30
Aug 2026
57
33
Sep 2026
61
38
Oct 2026
50
36
Nov 2025
55
34
Dec 2025
57
43
Homes for sale1,127 homes for sale vs. 715 in a normal October.See the numbers
Month
Last 12 months
10-year average
Jan 2026
764
398
Feb 2026
856
424
Mar 2026
927
483
Apr 2026
1,060
548
May 2026
1,118
614
Jun 2026
1,150
667
Jul 2026
1,174
692
Aug 2026
1,205
692
Sep 2026
1,220
744
Oct 2026
1,127
715
Nov 2025
886
515
Dec 2025
642
380
New listings327 new listings vs. 304 normally.See the numbers
Month
Last 12 months
10-year average
Jan 2026
405
254
Feb 2026
343
269
Mar 2026
410
352
Apr 2026
473
367
May 2026
440
389
Jun 2026
406
380
Jul 2026
438
355
Aug 2026
399
329
Sep 2026
444
383
Oct 2026
327
304
Nov 2025
212
179
Dec 2025
115
94
Closed sales115 closed sales vs. 198 normally.See the numbers
Month
Last 12 months
10-year average
Jan 2026
124
127
Feb 2026
161
175
Mar 2026
171
214
Apr 2026
186
217
May 2026
188
240
Jun 2026
184
238
Jul 2026
166
223
Aug 2026
134
219
Sep 2026
136
201
Oct 2026
115
198
Nov 2025
143
183
Dec 2025
172
174
Eastside houses: October 2026 vs. a normal year
Months of supply4.7 months of supply vs. 1.6 in a normal October: more choice for buyers.See the numbers
Month
Last 12 months
10-year average
Jan 2026
3.6
1.8
Feb 2026
3.1
1.6
Mar 2026
2.8
1.3
Apr 2026
3.5
1.4
May 2026
3.7
1.5
Jun 2026
3.3
1.5
Jul 2026
4.0
1.7
Aug 2026
4.6
1.6
Sep 2026
4.5
1.8
Oct 2026
4.7
1.6
Nov 2025
2.5
1.2
Dec 2025
1.6
1.0
Sale price % of list priceSelling at 97.0% of list price vs. 100.5% normally: below normal.See the numbers
Month
Last 12 months
10-year average
Jan 2026
97.2%
101.4%
Feb 2026
99.2%
104.5%
Mar 2026
100.2%
105.3%
Apr 2026
99.4%
105.0%
May 2026
99.1%
103.8%
Jun 2026
98.0%
102.5%
Jul 2026
97.6%
101.5%
Aug 2026
97.4%
100.5%
Sep 2026
97.2%
100.4%
Oct 2026
97.0%
100.5%
Nov 2025
97.7%
100.9%
Dec 2025
97.1%
100.9%
Days on market34 days on market vs. 26 normally: homes are selling slower.See the numbers
Month
Last 12 months
10-year average
Jan 2026
51
39
Feb 2026
41
32
Mar 2026
20
21
Apr 2026
20
16
May 2026
21
16
Jun 2026
22
17
Jul 2026
25
19
Aug 2026
30
21
Sep 2026
32
24
Oct 2026
34
26
Nov 2025
32
26
Dec 2025
49
33
Homes for sale1,387 homes for sale vs. 722 in a normal October.See the numbers
Month
Last 12 months
10-year average
Jan 2026
528
362
Feb 2026
685
396
Mar 2026
897
501
Apr 2026
1,203
613
May 2026
1,411
751
Jun 2026
1,466
843
Jul 2026
1,544
866
Aug 2026
1,486
825
Sep 2026
1,564
833
Oct 2026
1,387
722
Nov 2025
635
485
Dec 2025
451
335
New listings530 new listings vs. 469 normally.See the numbers
Month
Last 12 months
10-year average
Jan 2026
373
332
Feb 2026
497
410
Mar 2026
743
654
Apr 2026
875
670
May 2026
930
816
Jun 2026
835
772
Jul 2026
808
672
Aug 2026
669
601
Sep 2026
817
625
Oct 2026
530
469
Nov 2025
177
257
Dec 2025
99
140
Closed sales298 closed sales vs. 456 normally.See the numbers
Month
Last 12 months
10-year average
Jan 2026
147
200
Feb 2026
221
254
Mar 2026
320
374
Apr 2026
346
437
May 2026
380
502
Jun 2026
442
562
Jul 2026
384
526
Aug 2026
326
511
Sep 2026
348
454
Oct 2026
298
456
Nov 2025
256
395
Dec 2025
274
345
Eastside townhomes: October 2026 vs. a normal year
Months of supply9.8 months of supply vs. 1.9 in a normal October: more choice for buyers.See the numbers
Month
Last 12 months
10-year average
Jan 2026
5.2
1.9
Feb 2026
4.3
1.6
Mar 2026
3.2
1.4
Apr 2026
4.5
1.5
May 2026
4.6
1.6
Jun 2026
4.7
1.7
Jul 2026
5.5
1.9
Aug 2026
8.0
2.1
Sep 2026
6.9
2.1
Oct 2026
9.8
1.9
Nov 2025
3.7
1.3
Dec 2025
3.2
1.1
Sale price % of list priceSelling at 98.1% of list price vs. 99.9% normally: below normal.See the numbers
Month
Last 12 months
10-year average
Jan 2026
97.8%
100.7%
Feb 2026
98.9%
102.8%
Mar 2026
98.5%
104.0%
Apr 2026
97.9%
103.8%
May 2026
98.7%
103.0%
Jun 2026
97.5%
101.9%
Jul 2026
97.8%
100.9%
Aug 2026
98.1%
100.4%
Sep 2026
97.5%
99.9%
Oct 2026
98.1%
99.9%
Nov 2025
98.3%
100.3%
Dec 2025
98.5%
100.6%
Days on market35 days on market vs. 25 normally: homes are selling slower.See the numbers
Month
Last 12 months
10-year average
Jan 2026
48
34
Feb 2026
55
29
Mar 2026
41
21
Apr 2026
37
15
May 2026
31
18
Jun 2026
41
17
Jul 2026
46
20
Aug 2026
50
21
Sep 2026
47
23
Oct 2026
35
25
Nov 2025
47
27
Dec 2025
43
28
Homes for sale314 homes for sale vs. 139 in a normal October.See the numbers
Month
Last 12 months
10-year average
Jan 2026
227
74
Feb 2026
252
82
Mar 2026
279
96
Apr 2026
329
110
May 2026
328
125
Jun 2026
322
134
Jul 2026
328
145
Aug 2026
320
148
Sep 2026
346
153
Oct 2026
314
139
Nov 2025
223
84
Dec 2025
199
65
New listings73 new listings vs. 78 normally.See the numbers
Month
Last 12 months
10-year average
Jan 2026
133
75
Feb 2026
126
80
Mar 2026
167
111
Apr 2026
166
101
May 2026
163
122
Jun 2026
134
109
Jul 2026
138
107
Aug 2026
99
104
Sep 2026
129
99
Oct 2026
73
78
Nov 2025
53
47
Dec 2025
41
28
Closed sales32 closed sales vs. 75 normally.See the numbers
Month
Last 12 months
10-year average
Jan 2026
44
39
Feb 2026
58
53
Mar 2026
87
68
Apr 2026
73
75
May 2026
72
79
Jun 2026
69
81
Jul 2026
60
75
Aug 2026
40
72
Sep 2026
50
72
Oct 2026
32
75
Nov 2025
60
66
Dec 2025
63
62
Eastside condos: October 2026 vs. a normal year
Months of supply6.3 months of supply vs. 2.1 in a normal October: more choice for buyers.See the numbers
Month
Last 12 months
10-year average
Jan 2026
5.3
1.8
Feb 2026
6.4
1.6
Mar 2026
4.2
1.4
Apr 2026
5.8
1.5
May 2026
6.5
1.7
Jun 2026
7.5
1.9
Jul 2026
6.1
2.0
Aug 2026
7.1
2.0
Sep 2026
6.1
2.2
Oct 2026
6.3
2.1
Nov 2025
5.5
1.6
Dec 2025
3.5
1.4
Sale price % of list priceSelling at 96.5% of list price vs. 99.1% normally: below normal.See the numbers
Month
Last 12 months
10-year average
Jan 2026
96.9%
99.8%
Feb 2026
98.8%
101.3%
Mar 2026
97.6%
101.9%
Apr 2026
98.3%
102.3%
May 2026
98.3%
101.9%
Jun 2026
98.1%
100.9%
Jul 2026
97.6%
100.4%
Aug 2026
96.7%
99.6%
Sep 2026
96.8%
99.2%
Oct 2026
96.5%
99.1%
Nov 2025
97.9%
99.5%
Dec 2025
98.0%
99.4%
Days on market55 days on market vs. 30 normally: homes are selling slower.See the numbers
Month
Last 12 months
10-year average
Jan 2026
65
40
Feb 2026
49
37
Mar 2026
37
24
Apr 2026
36
24
May 2026
46
21
Jun 2026
35
22
Jul 2026
43
22
Aug 2026
56
26
Sep 2026
55
29
Oct 2026
55
30
Nov 2025
44
27
Dec 2025
48
35
Homes for sale507 homes for sale vs. 277 in a normal October.See the numbers
Month
Last 12 months
10-year average
Jan 2026
324
149
Feb 2026
403
164
Mar 2026
456
189
Apr 2026
519
209
May 2026
574
241
Jun 2026
600
261
Jul 2026
623
281
Aug 2026
594
284
Sep 2026
556
294
Oct 2026
507
277
Nov 2025
354
197
Dec 2025
275
144
New listings170 new listings vs. 167 normally.See the numbers
Month
Last 12 months
10-year average
Jan 2026
170
135
Feb 2026
205
146
Mar 2026
216
198
Apr 2026
240
187
May 2026
239
205
Jun 2026
228
209
Jul 2026
240
208
Aug 2026
188
184
Sep 2026
209
192
Oct 2026
170
167
Nov 2025
102
99
Dec 2025
61
59
Closed sales81 closed sales vs. 132 normally.See the numbers
Month
Last 12 months
10-year average
Jan 2026
61
82
Feb 2026
63
106
Mar 2026
109
140
Apr 2026
90
136
May 2026
88
140
Jun 2026
80
139
Jul 2026
102
141
Aug 2026
84
143
Sep 2026
91
136
Oct 2026
81
132
Nov 2025
64
121
Dec 2025
78
106
More: homes for sale, closings and the full table
Homes for sale vs. a typical October52% to 126% above normal for every home type.See the numbers
Segment
Oct 2026
10-year Oct avg
Seattle houses
1,281
845
Seattle townhomes
693
411
Seattle condos
1,127
715
Eastside houses
1,387
722
Eastside townhomes
314
139
Eastside condos
507
277
Closed sales vs. a typical OctoberBelow normal for every home type.See the numbers
Segment
Oct 2026
10-year Oct avg
Seattle houses
418
544
Seattle townhomes
100
152
Seattle condos
115
198
Eastside houses
298
456
Eastside townhomes
32
75
Eastside condos
81
132
Segment
Months of supply
Sale to list
Days on market
For sale
Closed
Seattle houses
3.1avg 1.6
99.6%avg 101.2%
23avg 20
1,281avg 845
418avg 544
Seattle townhomes
6.9avg 2.7
98.9%avg 99.8%
35avg 28
693avg 411
100avg 152
Seattle condos
9.8avg 3.6
97.2%avg 99.3%
50avg 36
1,127avg 715
115avg 198
Eastside houses
4.7avg 1.6
97.0%avg 100.5%
34avg 26
1,387avg 722
298avg 456
Eastside townhomes
9.8avg 1.9
98.1%avg 99.9%
35avg 25
314avg 139
32avg 75
Eastside condos
6.3avg 2.1
96.5%avg 99.1%
55avg 30
507avg 277
81avg 132
Normal
The 10-year average for that calendar month: the mean of that month's values from November 2016 through October 2026.
Months of supply
Homes for sale at month end divided by that month's closed sales. Lower means more competition among buyers.
Sale to list
Sale price as a percent of the final list price. Final listing only; canceled and relisted history not counted. Days on market count the final listing only too.
Days on market
The average for homes that sold that month.
Areas
Seattle is the City of Seattle. The Eastside is Bellevue, Kirkland, Redmond, Mercer Island, Sammamish, Issaquah, Newcastle and Woodinville.
Home types
Townhomes are any NWMLS townhouse-style listing, filed as Residential or Condominium. Houses and condos exclude that style.
Source
NWMLS via InfoSparks. Updated monthly once NWMLS posts the prior month.
It leans toward buyers this fall. The share of King County listings going pending each month was 22.7% in October, down from 31.4% a year earlier and a 40.8% spring peak. In October every Seattle and Eastside segment had more supply than a typical October.
What share of homes for sale go pending each month?In King County, 22.7% of homes for sale went pending in October, about where it has held since July and down from 31.4% a year earlier. Lower means a slower, more buyer-friendly market.See the numbers
144 in Seattle and 392 across King County last week. Seattle pendings rose 13.4%, King County 12.3% and Snohomish County 2.2%, while the Eastside slipped 4.3% to 110 and Pierce County fell 13.8%. Seattle is still below a mid-September high of 199.
How many homes go pending each week?Seattle had 144 new pendings the week of Nov 8, up 13.4% from 127 the week before and still below a mid-September high of 199. The Eastside had 110, down from 115.See the numbers
Week
Seattle
Eastside
Week of Aug 2, 2026
130
129
Week of Aug 9, 2026
157
141
Week of Aug 16, 2026
145
138
Week of Aug 23, 2026
129
142
Week of Aug 30, 2026
131
146
Week of Sep 6, 2026
115
116
Week of Sep 13, 2026
199
146
Week of Sep 20, 2026
186
137
Week of Sep 27, 2026
176
124
Week of Oct 4, 2026
157
111
Week of Oct 11, 2026
169
129
Week of Oct 18, 2026
128
109
Week of Oct 25, 2026
142
89
Week of Nov 1, 2026
127
115
Week of Nov 8, 2026
144
110
Pending sales, change vs. last weekWeek of Nov 8 to 14 vs. Nov 1 to 7.See the numbers
Area
Change vs. prior week
Seattle
+13.4%
Eastside
−4.3%
King County
+12.3%
Snohomish County
+2.2%
Pierce County
−13.8%
More: all 5 areas and 15-week trends by area
Area
For sale
New listings
Pending
Sold
Seattle
2,800−3.0% vs. prior week
180−31.8% vs. prior week
144+13.4% vs. prior week
108−15.6% vs. prior week
Eastside
2,291−5.3% vs. prior week
114−40.6% vs. prior week
110−4.3% vs. prior week
76−29.6% vs. prior week
King County
7,205−4.0% vs. prior week
418−31.6% vs. prior week
392+12.3% vs. prior week
262−21.6% vs. prior week
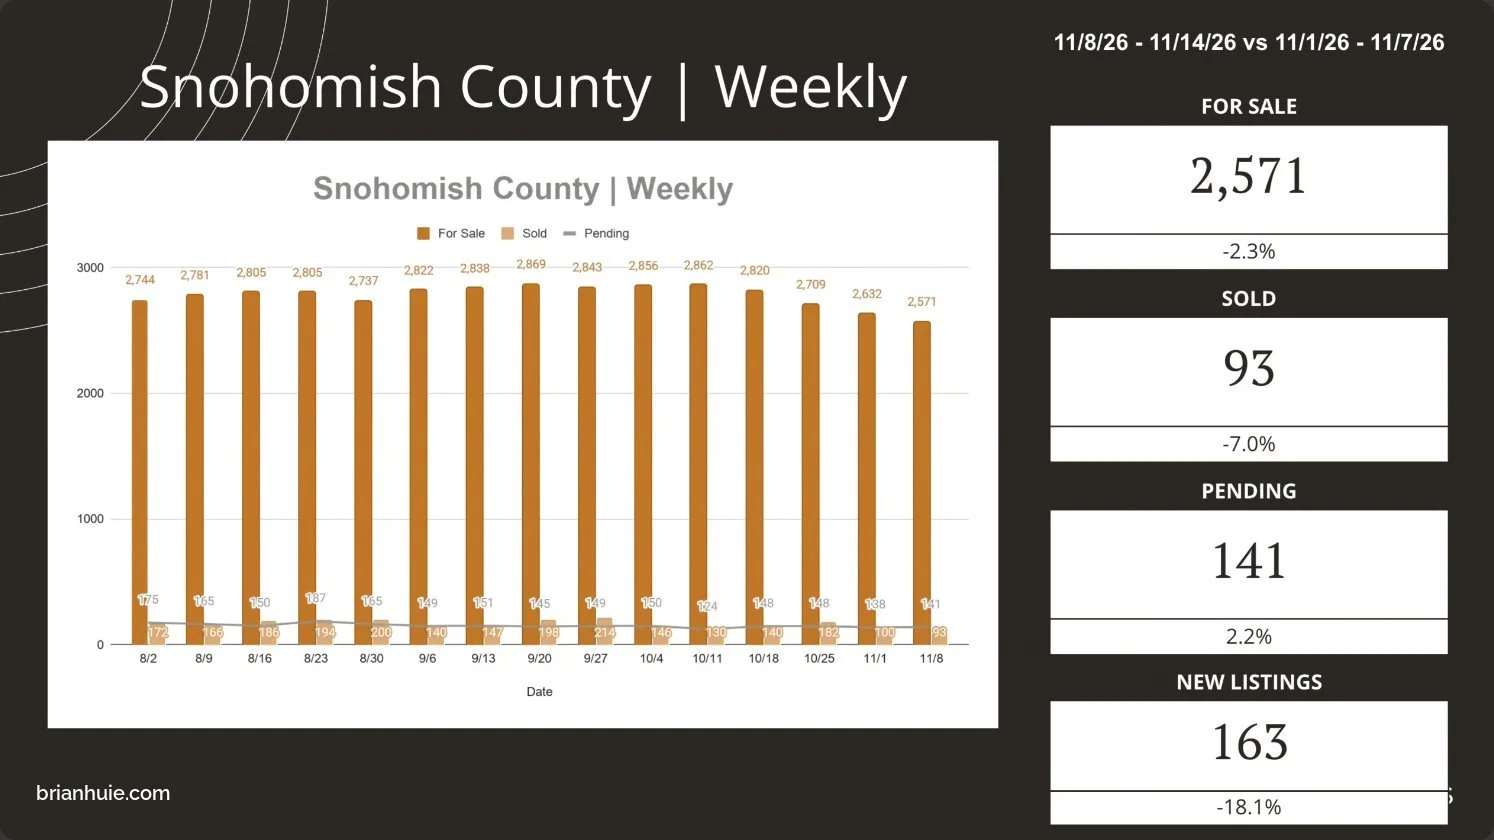
Snohomish County
2,571−2.3% vs. prior week
163−18.1% vs. prior week
141+2.2% vs. prior week
93−7.0% vs. prior week
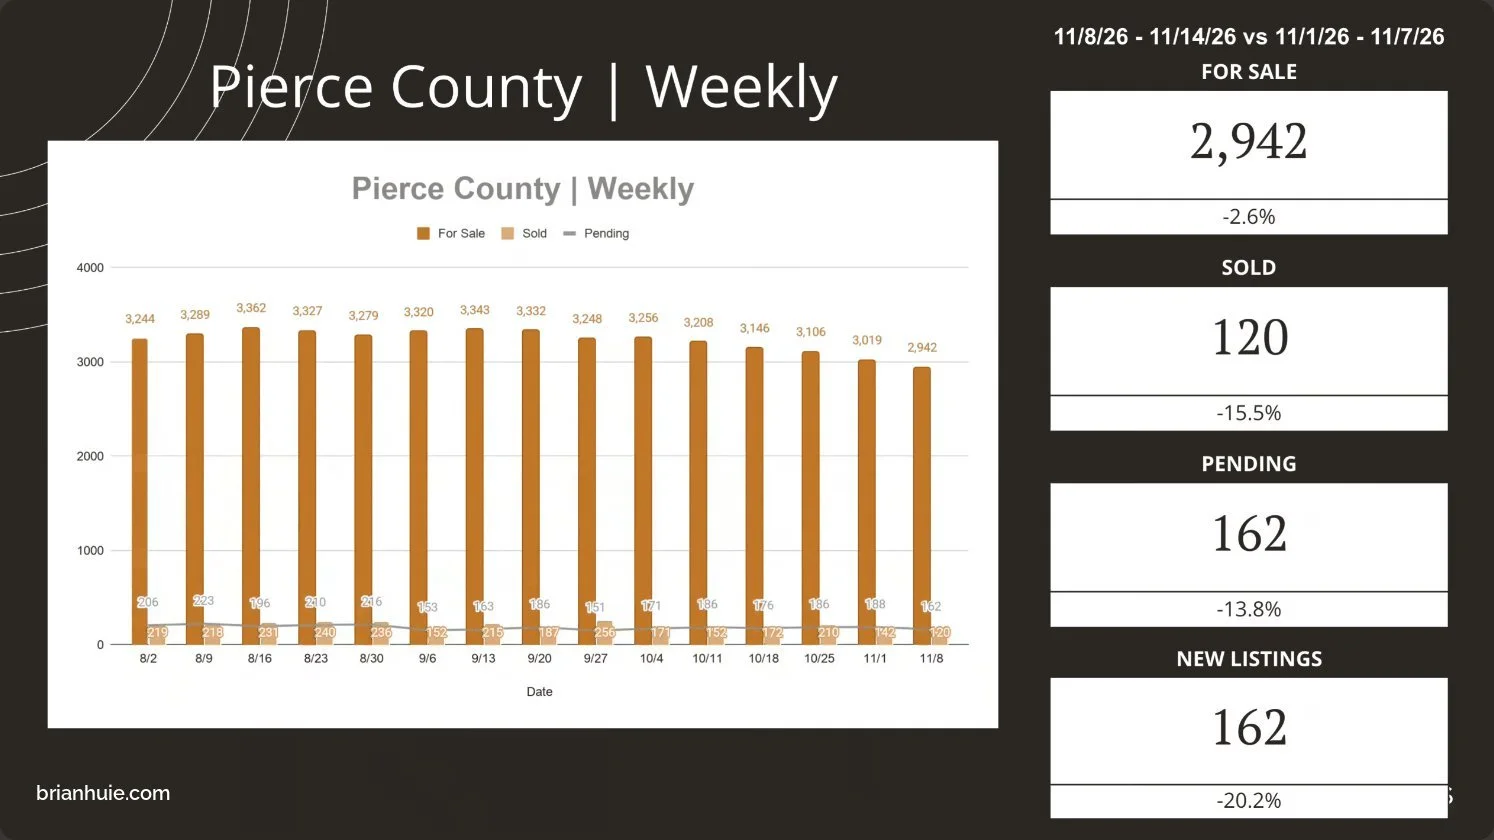
Pierce County
2,942−2.6% vs. prior week
162−20.2% vs. prior week
162−13.8% vs. prior week
120−15.5% vs. prior week
Closed sales, change vs. last weekSee the numbers
Area
Change vs. prior week
Seattle
−15.6%
Eastside
−29.6%
King County
−21.6%
Snohomish County
−7.0%
Pierce County
−15.5%
Homes for sale, change vs. last weekSee the numbers
Area
Change vs. prior week
Seattle
−3.0%
Eastside
−5.3%
King County
−4.0%
Snohomish County
−2.3%
Pierce County
−2.6%
The last 15 weeks, by area
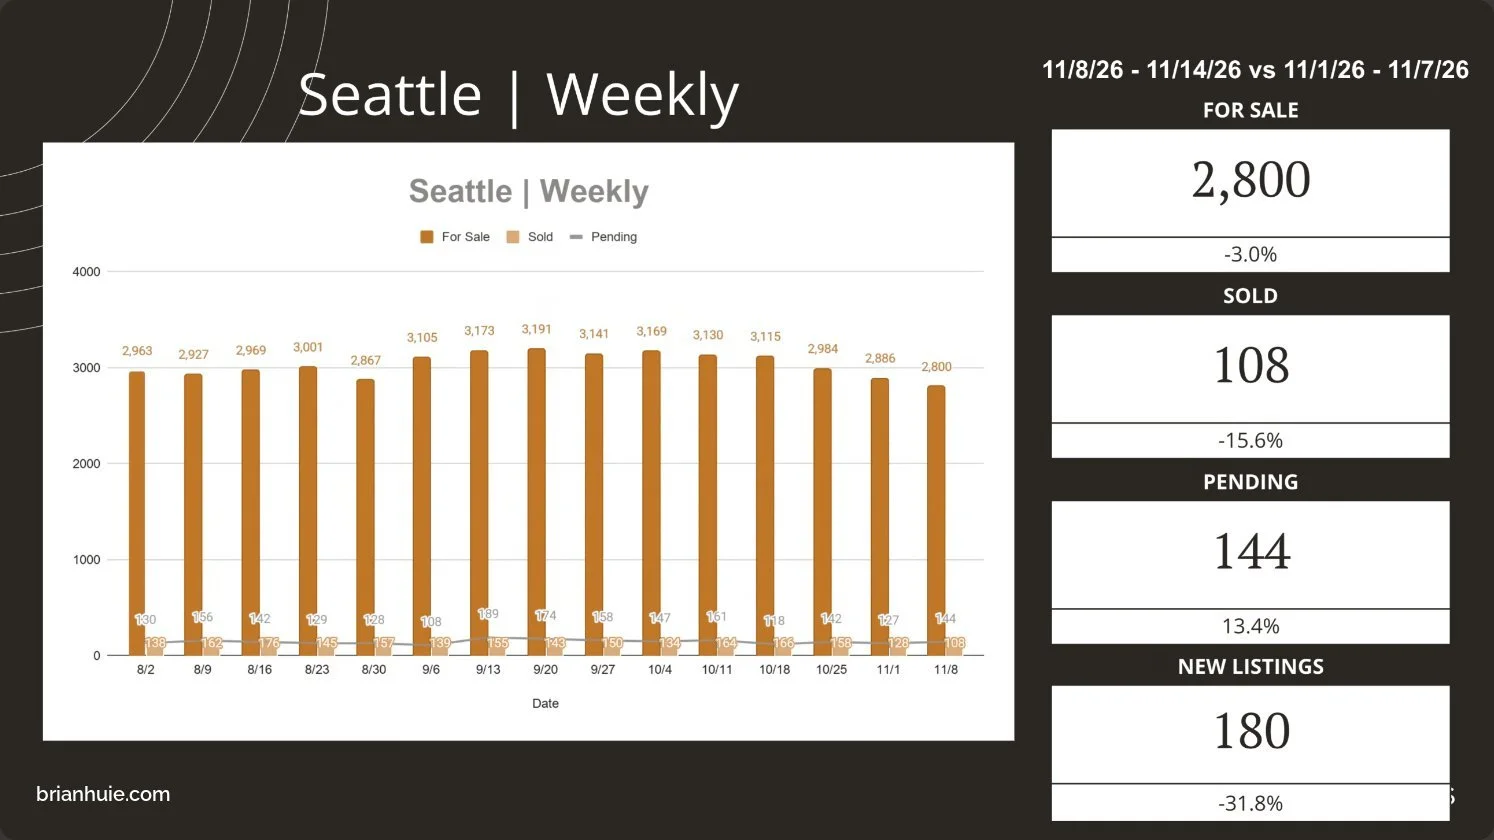
Over the last 15 weeks, Seattle averaged 149 new pendings and 150 closings a week, with 2,800 to 3,191 homes for sale.
Seattle: homes for sale each weekSee the numbers
Week
For sale
Week of Aug 2, 2026
2,963
Week of Aug 9, 2026
2,927
Week of Aug 16, 2026
2,969
Week of Aug 23, 2026
3,001
Week of Aug 30, 2026
2,867
Week of Sep 6, 2026
3,105
Week of Sep 13, 2026
3,173
Week of Sep 20, 2026
3,191
Week of Sep 27, 2026
3,141
Week of Oct 4, 2026
3,169
Week of Oct 11, 2026
3,130
Week of Oct 18, 2026
3,115
Week of Oct 25, 2026
2,984
Week of Nov 1, 2026
2,886
Week of Nov 8, 2026
2,800
Seattle: homes going pending and closing each weekSee the numbers
Week
Pending
Sold
Week of Aug 2, 2026
130
138
Week of Aug 9, 2026
157
162
Week of Aug 16, 2026
145
175
Week of Aug 23, 2026
129
145
Week of Aug 30, 2026
131
157
Week of Sep 6, 2026
115
138
Week of Sep 13, 2026
199
154
Week of Sep 20, 2026
186
146
Week of Sep 27, 2026
176
154
Week of Oct 4, 2026
157
140
Week of Oct 11, 2026
169
172
Week of Oct 18, 2026
128
171
Week of Oct 25, 2026
142
155
Week of Nov 1, 2026
127
128
Week of Nov 8, 2026
144
108
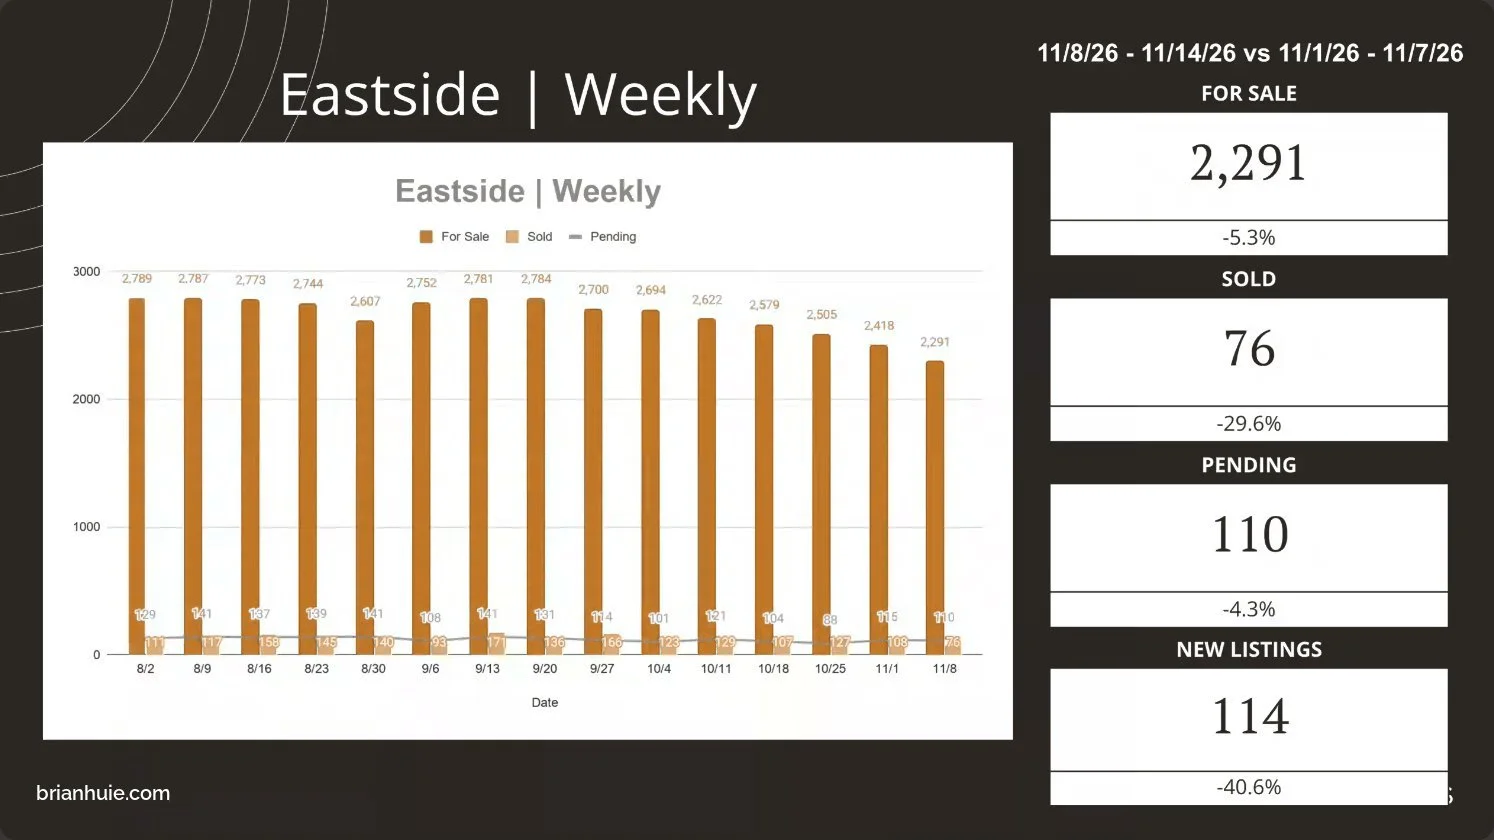
Over the last 15 weeks, Eastside averaged 125 new pendings and 128 closings a week, with 2,291 to 2,789 homes for sale.
Eastside: homes for sale each weekSee the numbers
Week
For sale
Week of Aug 2, 2026
2,789
Week of Aug 9, 2026
2,787
Week of Aug 16, 2026
2,773
Week of Aug 23, 2026
2,744
Week of Aug 30, 2026
2,607
Week of Sep 6, 2026
2,752
Week of Sep 13, 2026
2,781
Week of Sep 20, 2026
2,784
Week of Sep 27, 2026
2,700
Week of Oct 4, 2026
2,694
Week of Oct 11, 2026
2,622
Week of Oct 18, 2026
2,579
Week of Oct 25, 2026
2,505
Week of Nov 1, 2026
2,418
Week of Nov 8, 2026
2,291
Eastside: homes going pending and closing each weekSee the numbers
Week
Pending
Sold
Week of Aug 2, 2026
129
111
Week of Aug 9, 2026
141
117
Week of Aug 16, 2026
138
158
Week of Aug 23, 2026
142
145
Week of Aug 30, 2026
146
139
Week of Sep 6, 2026
116
93
Week of Sep 13, 2026
146
171
Week of Sep 20, 2026
137
136
Week of Sep 27, 2026
124
174
Week of Oct 4, 2026
111
127
Week of Oct 11, 2026
129
134
Week of Oct 18, 2026
109
110
Week of Oct 25, 2026
89
123
Week of Nov 1, 2026
115
108
Week of Nov 8, 2026
110
76
Over the last 15 weeks, King County averaged 408 new pendings and 409 closings a week, with 7,205 to 8,362 homes for sale.
King County: homes for sale each weekSee the numbers
Week
For sale
Week of Aug 2, 2026
8,056
Week of Aug 9, 2026
7,990
Week of Aug 16, 2026
8,060
Week of Aug 23, 2026
8,071
Week of Aug 30, 2026
7,809
Week of Sep 6, 2026
8,265
Week of Sep 13, 2026
8,357
Week of Sep 20, 2026
8,362
Week of Sep 27, 2026
8,177
Week of Oct 4, 2026
8,223
Week of Oct 11, 2026
8,078
Week of Oct 18, 2026
8,002
Week of Oct 25, 2026
7,726
Week of Nov 1, 2026
7,507
Week of Nov 8, 2026
7,205
King County: homes going pending and closing each weekSee the numbers
Week
Pending
Sold
Week of Aug 2, 2026
388
386
Week of Aug 9, 2026
451
391
Week of Aug 16, 2026
410
486
Week of Aug 23, 2026
413
453
Week of Aug 30, 2026
397
445
Week of Sep 6, 2026
345
325
Week of Sep 13, 2026
497
463
Week of Sep 20, 2026
457
413
Week of Sep 27, 2026
437
523
Week of Oct 4, 2026
390
404
Week of Oct 11, 2026
436
439
Week of Oct 18, 2026
376
388
Week of Oct 25, 2026
376
421
Week of Nov 1, 2026
349
334
Week of Nov 8, 2026
392
262
Pending
Homes that went under contract during the week.
Sold
Homes that closed during the week. Closings usually follow pendings by about 9 to 25 days.
Source
Compass Pacific Northwest weekly market report, MLS data. Preliminary and revised as sales are reported. The Eastside follows Compass's regional definition in this section.
How much are Seattle-area buyers paying?
Close to asking, but rarely over. King County houses and townhomes are going pending at 98% of list price with an $850,000 median. Condos are going pending at 97% of list price with a $493,000 median, and only 9% of condo deals drew multiple offers. Fewer house deals have multiple offers, and more buyers keep their financing protection.
Houses & townhomes: what buyers are agreeing toMedian pending price $850,000 today vs. $899,900 over the past 3 months. 1,488 pending today; 4,457 went pending in the past 3 months.See the numbers
Measure
Past 3 months
Today
Pending price to list price
98%
98%
Pendings with multiple offers
22%
19%
Pendings with an escalation clause
8%
4%
Pendings with a financing contingency
74%
76%
Pendings with an inspection contingency
51%
53%
Condos: what buyers are agreeing toMedian pending price $493,000 today vs. $480,000 over the past 3 months. 384 pending today; 1,090 went pending in the past 3 months.See the numbers
Measure
Past 3 months
Today
Pending price to list price
97%
97%
Pendings with multiple offers
8%
9%
Pendings with an escalation clause
2%
2%
Pendings with a financing contingency
61%
70%
Pendings with an inspection contingency
63%
60%
More: houses vs. condos, medians and what each term means
Houses vs. condos, todayCondo buyers face less competition: 9% of condo pendings had multiple offers vs. 19% of houses.See the numbers
Measure
Houses & townhomes
Condos
Pending price to list price
98%
97%
Pendings with multiple offers
19%
9%
Pendings with an escalation clause
4%
2%
Pendings with a financing contingency
76%
70%
Pendings with an inspection contingency
53%
60%
Median pending priceThe house median is 5.5% below its three-month level and the condo median 2.7% above.See the numbers
Type
Past 3 months
Today
Houses & townhomes
$899,900
$850,000
Condos
$480,000
$493,000
Pending price to list
The agreed price as a share of the list price at the time of the deal. 98% on a $1,000,000 house is about $980,000.
Sale to list (10-year chart)
Sale price as a share of the final list price. Final listing only; canceled and relisted history not counted.
Multiple offers
The share of pending sales where the seller received more than one offer.
Escalation clause
An offer that automatically beats competing offers by a set amount, up to a cap.
Financing contingency
Lets the buyer back out if their loan falls through. More buyers keep it when competition eases.
Inspection contingency
Lets the buyer inspect and negotiate repairs or walk away.
Source
NWMLS Pending Data Reports, King County, pulled November 9, 2026. Houses & townhomes = NWMLS Residential; condos = NWMLS Condominium. Past 3 months = August 9 to November 9, 2026.
Are more homes coming on the market?
New listings dropped ahead of the holidays, but far more homes are for sale than a year ago. New listings fell in every area last week: down 31.8% in Seattle, 40.6% on the Eastside and 31.6% across King County. King County had 7,726 homes for sale in October, 28.7% more than a year ago, and homes are taking longer to sell.
New listings, change vs. last weekWeek of Nov 8 to 14 vs. Nov 1 to 7.See the numbers
Area
Change vs. prior week
Seattle
−31.8%
Eastside
−40.6%
King County
−31.6%
Snohomish County
−18.1%
Pierce County
−20.2%
How many homes are for sale?Seattle inventory held near 3,100 to 3,200 from early September to mid-October and eased to 2,800 last week, its lowest in this 15-week view. The Eastside fell to 2,291, also its lowest in this view.See the numbers
Week
Seattle
Eastside
Week of Aug 2, 2026
2,963
2,789
Week of Aug 9, 2026
2,927
2,787
Week of Aug 16, 2026
2,969
2,773
Week of Aug 23, 2026
3,001
2,744
Week of Aug 30, 2026
2,867
2,607
Week of Sep 6, 2026
3,105
2,752
Week of Sep 13, 2026
3,173
2,781
Week of Sep 20, 2026
3,191
2,784
Week of Sep 27, 2026
3,141
2,700
Week of Oct 4, 2026
3,169
2,694
Week of Oct 11, 2026
3,130
2,622
Week of Oct 18, 2026
3,115
2,579
Week of Oct 25, 2026
2,984
2,505
Week of Nov 1, 2026
2,886
2,418
Week of Nov 8, 2026
2,800
2,291
King County: homes for sale vs. homes sellingInventory climbed from January to a September peak of 8,237 and eased to 7,726 in October, while monthly pending sales have stayed under about 2,200. That gap is what gives buyers negotiating power.See the numbers
Month
For sale
Pending
Sold
Aug 2025
6,246
1,997
2,162
Sep 2025
6,454
2,118
2,090
Oct 2025
6,003
1,884
2,278
Nov 2025
4,885
1,445
1,653
Dec 2025
3,542
1,042
1,732
Jan 2026
3,916
1,444
1,150
Feb 2026
4,522
1,644
1,509
Mar 2026
5,213
2,126
2,027
Apr 2026
6,159
2,085
2,186
May 2026
7,177
2,186
2,218
Jun 2026
7,729
2,039
2,335
Jul 2026
8,021
1,809
2,094
Aug 2026
7,997
1,791
1,873
Sep 2026
8,237
1,863
1,876
Oct 2026
7,726
1,752
1,772
More: King County month by month
King County homes for sale, by month7,726 homes were for sale in October 2026 (preliminary), 28.7% more than October 2025 and down from 8,237 in September, the most in this 15-month view.See the numbers
Month
For sale
Aug 2025
6,246
Sep 2025
6,454
Oct 2025
6,003
Nov 2025
4,885
Dec 2025
3,542
Jan 2026
3,916
Feb 2026
4,522
Mar 2026
5,213
Apr 2026
6,159
May 2026
7,177
Jun 2026
7,729
Jul 2026
8,021
Aug 2026
7,997
Sep 2026
8,237
Oct 2026
7,726
King County pending and closed sales, by monthPendings were 1,752 in October (preliminary), 7.0% below a year ago. Closed sales were 1,772, down 22.2%.See the numbers
Month
Pending
Sold
Aug 2025
1,997
2,162
Sep 2025
2,118
2,090
Oct 2025
1,884
2,278
Nov 2025
1,445
1,653
Dec 2025
1,042
1,732
Jan 2026
1,444
1,150
Feb 2026
1,644
1,509
Mar 2026
2,126
2,027
Apr 2026
2,085
2,186
May 2026
2,186
2,218
Jun 2026
2,039
2,335
Jul 2026
1,809
2,094
Aug 2026
1,791
1,873
Sep 2026
1,863
1,876
Oct 2026
1,752
1,772
What are local brokers seeing?
Pendings holding up, relists rising and buyers hunting for deals. Brian's notes from the weekly Compass Pacific Northwest market meeting on November 16, 2026. Homes, brokers and clients are not named.
Pendings are holding up into the holidays
The market presenter said King County pendings rose 12.3% last week while new listings fell 31.6%, and month-to-date pendings were down just 6.2% from the same point in October, a gentler slide than in past years at this time. King County days on market rose to 48, the highest in about 15 weeks.
More sellers are relisting, not pulling back
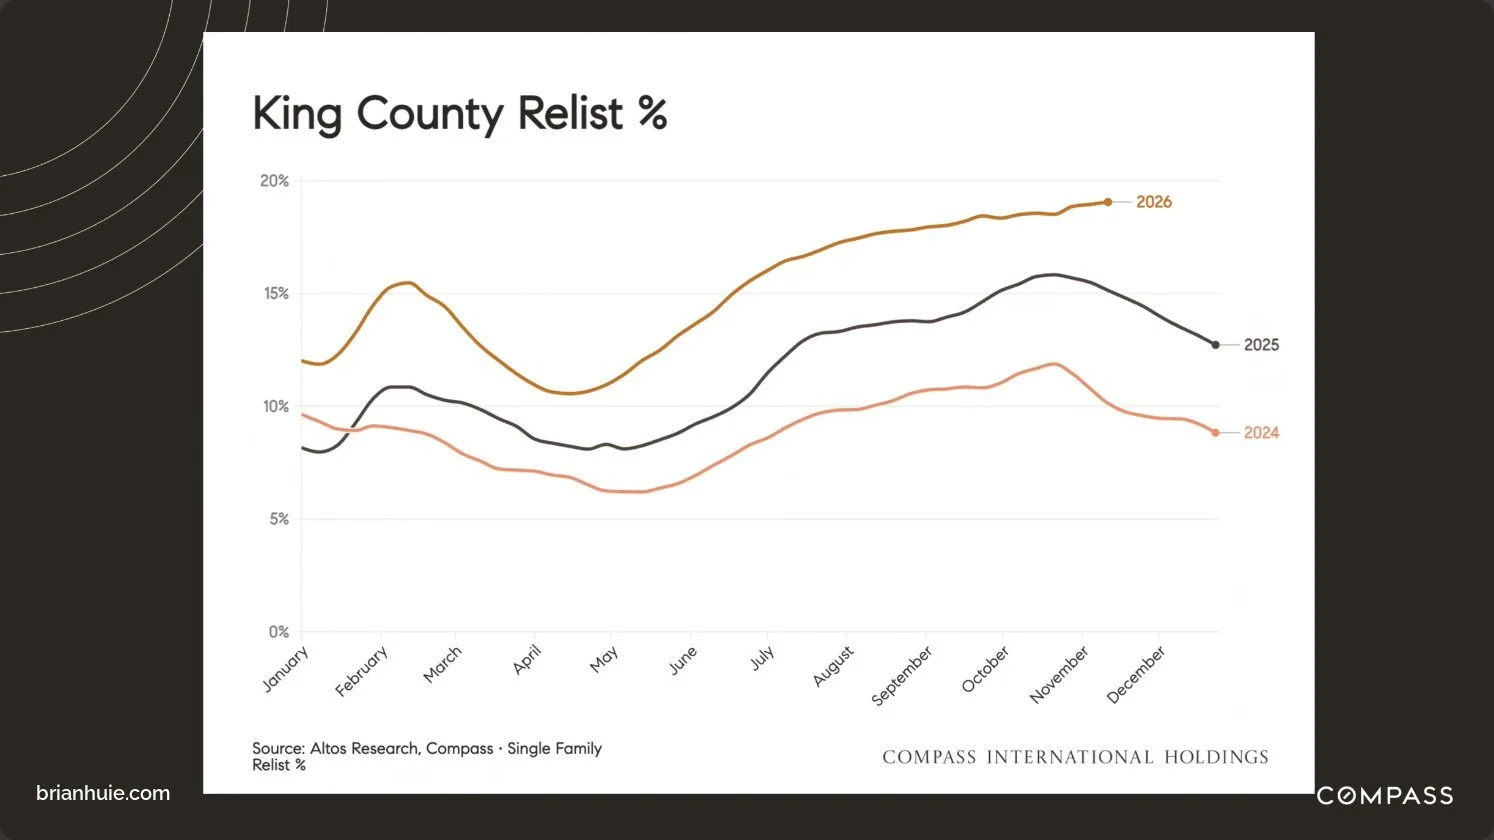
Relists, homes coming back on the market within a year, are still rising in King County this November, while in 2024 and 2025 they fell at this point as sellers stepped back for the holidays. The presenter tied it to sellers staying aggressive: about 42% of King County listings have cut their price, near the national average, and the share is still climbing.
Buyers are hunting for deals
Several brokers have buyers writing offers far below asking, in one case $300,000 to $400,000 under list on homes near $2 million. Ideas shared: search listings with 90 or more days on market and recently canceled or expired listings, and look at year-end new construction. Brokers also urged sellers to counter low offers; one seller who would not counter after 6 months on the market saw the buyer move on.
Canceled listings are drawing buyers back
Brokers described buyers returning after a listing came off the market: 2 recently canceled listings looked likely to get offers, and an expired listing sold to a buyer who had been watching it. One broker reminded sellers of vacant homes to check their insurance, since coverage can be limited once a home has sat empty for more than 2 months.
Quiet open houses, with a few bright spots
Many weekend open houses drew 1 to 3 groups or none, including a Seattle condo with no visitors for 2 weekends despite a 3% seller credit. In Kirkland, one family came back a second time with their kids and spent about 45 minutes measuring rooms, and a home listed 3 days earlier near Bothell was expecting an offer.
Do open houses help a home sell? New research shared at the October 12 meeting
A 2026 study by researchers from George Washington University and Villanova University (Carrillo, Kenney and Martinez, Agent Effort in Housing Search: Evidence from Open Houses), using listings from the Washington, D.C. area, found that holding an open house in a home’s first week raised the chance of a sale within 30 days by 17 percentage points, about 36%. It also pointed to a 2% to 4% higher sale price, a result at the edge of statistical significance. There was some evidence that an open house works better when no nearby homes are holding one the same day.
Research shared at the October 5 meeting found that in the Seattle metro, every percentage point between an owner’s mortgage rate and today’s rate makes that owner about 20% less likely to sell, which helps explain why fewer homes come up for sale.
This week’s slide deck
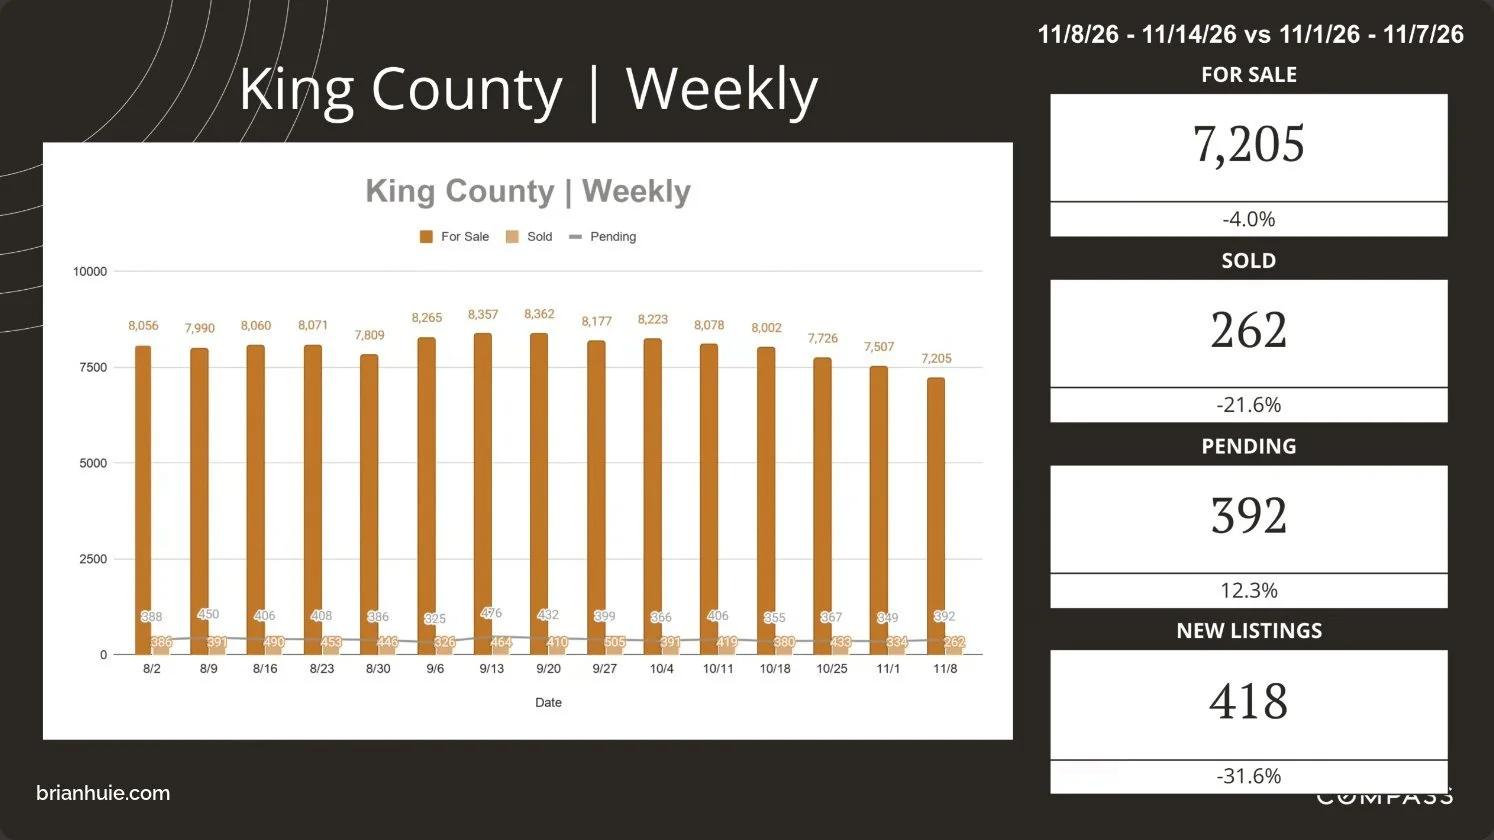
Slide imageKing County | WeeklyFor sale 7,205 · New 418 · Pending 392 · Sold 262
Slide imageSeattle | WeeklyFor sale 2,800 · New 180 · Pending 144 · Sold 108
Slide imageEastside | WeeklyFor sale 2,291 · New 114 · Pending 110 · Sold 76
Slide imageSnohomish County | WeeklyFor sale 2,571 · New 163 · Pending 141 · Sold 93
Slide imagePierce County | WeeklyFor sale 2,942 · New 162 · Pending 162 · Sold 120
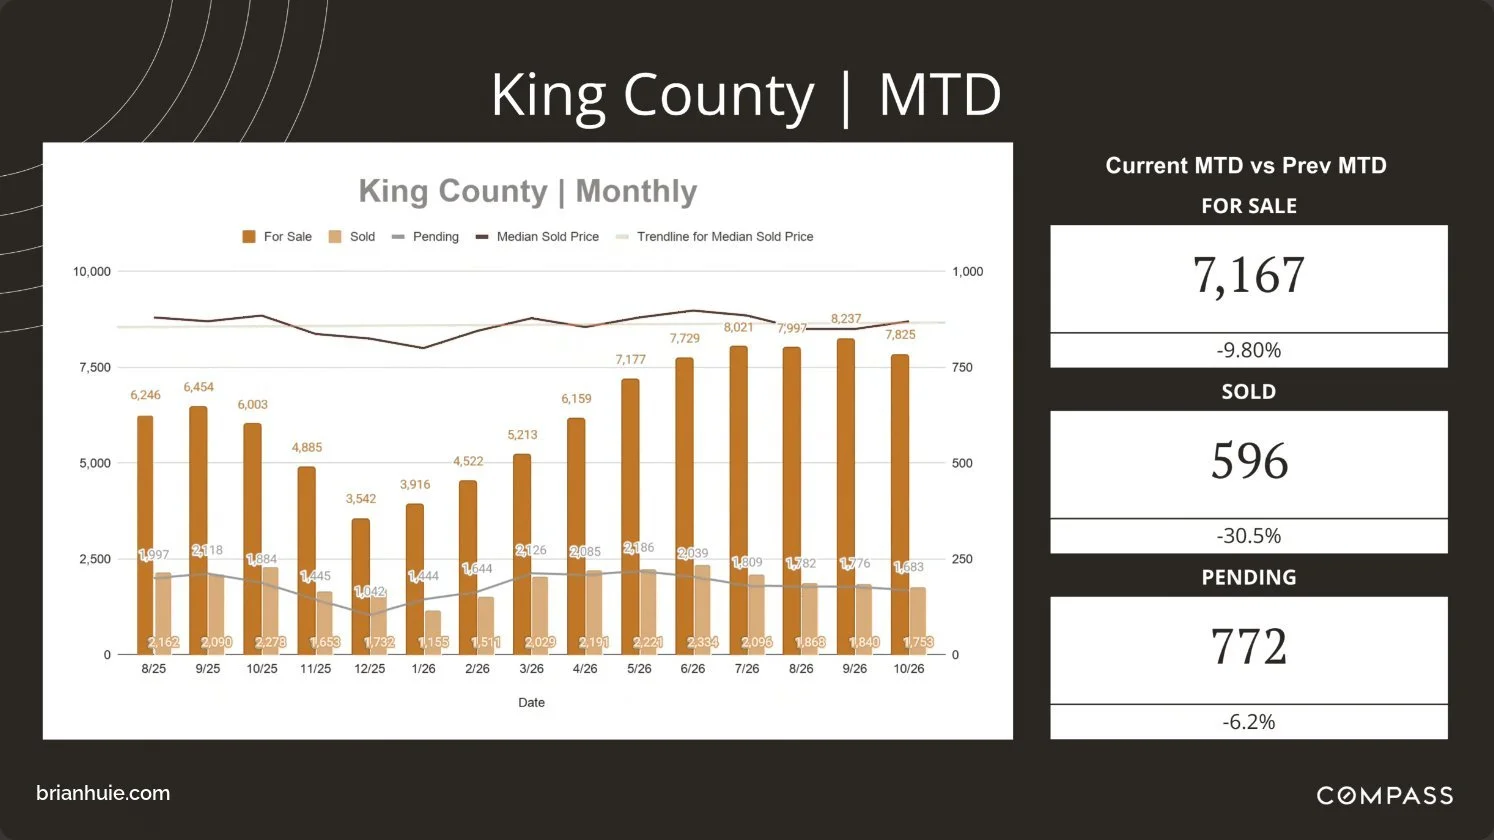
Slide imageKing County | Month to dateNovember month to date vs. the same point in October: For sale 7,167 (−9.8%) · Sold 596 (−30.5%) · Pending 772 (−6.2%)
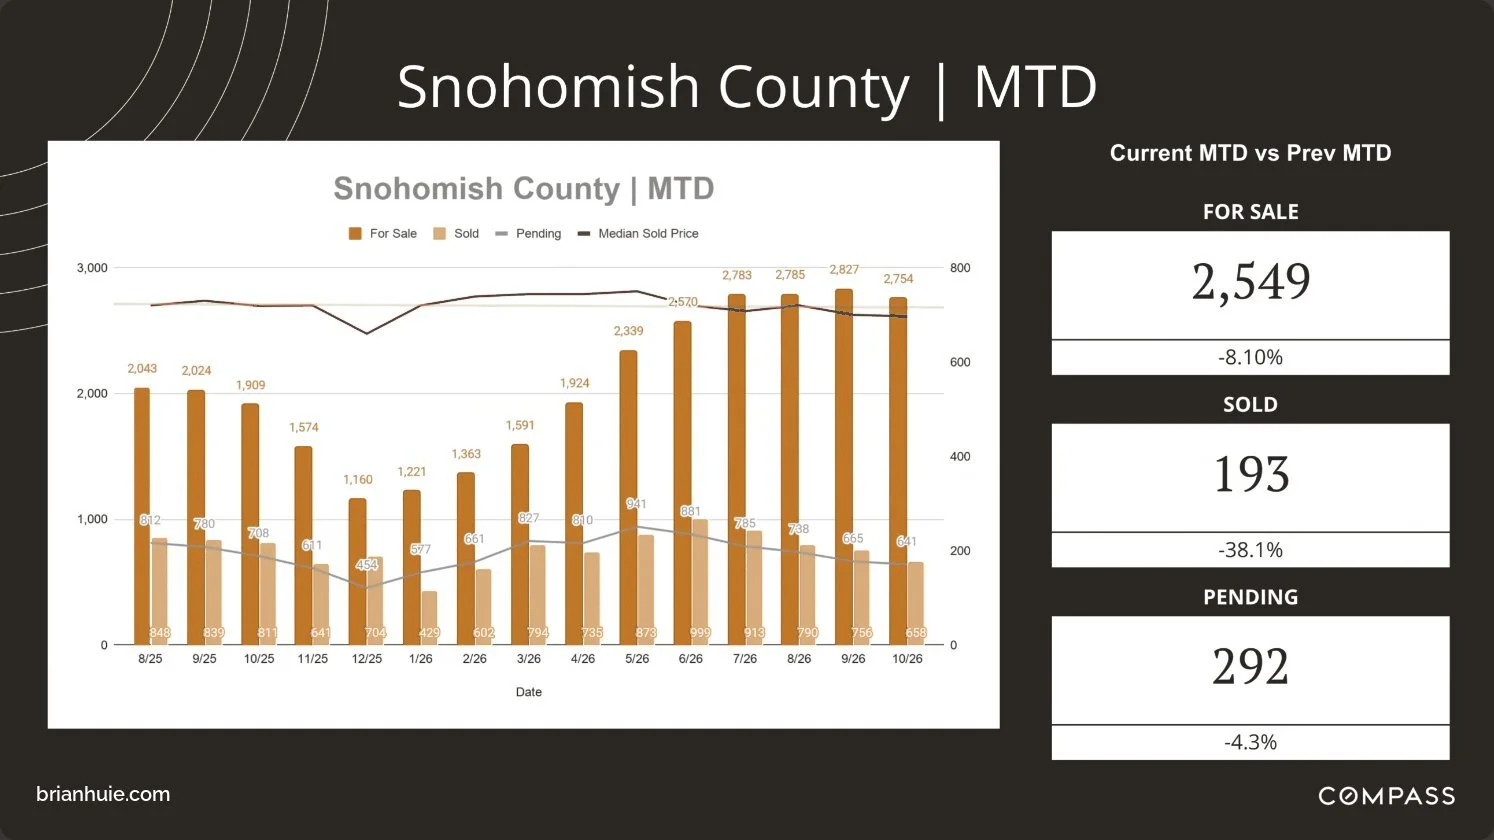
Slide imageSnohomish County | Month to dateNovember month to date vs. the same point in October: For sale 2,549 (−8.1%) · Sold 193 (−38.1%) · Pending 292 (−4.3%)
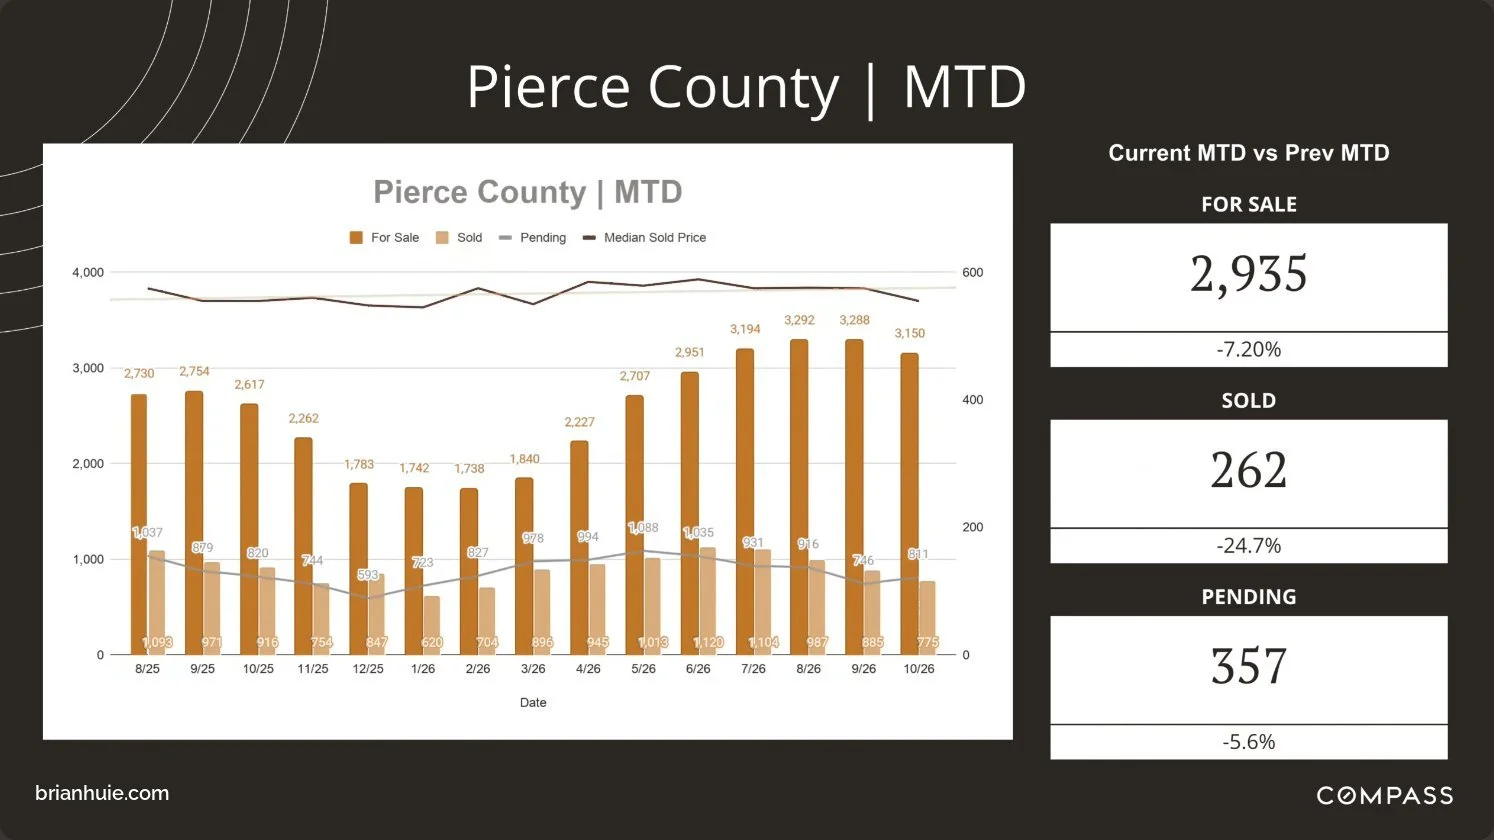
Slide imagePierce County | Month to dateNovember month to date vs. the same point in October: For sale 2,935 (−7.2%) · Sold 262 (−24.7%) · Pending 357 (−5.6%)
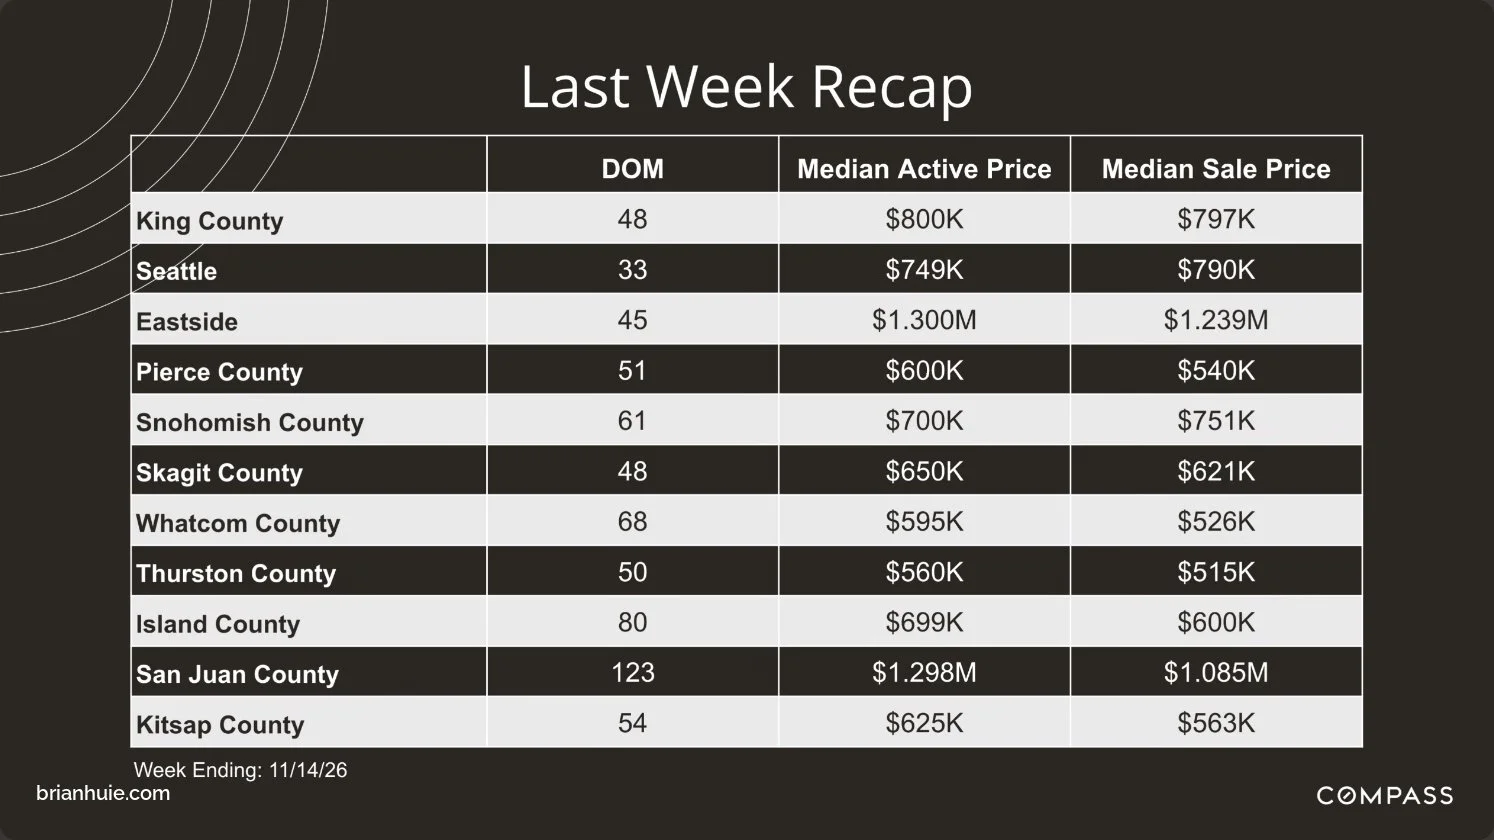
Slide imageLast Week RecapWeek ending Nov 14: King County 48 days on market, $800K median active, $797K median sale · Seattle 33, $749K, $790K · Eastside 45, $1.300M, $1.239M · Pierce 51, $600K, $540K · Snohomish 61, $700K, $751K
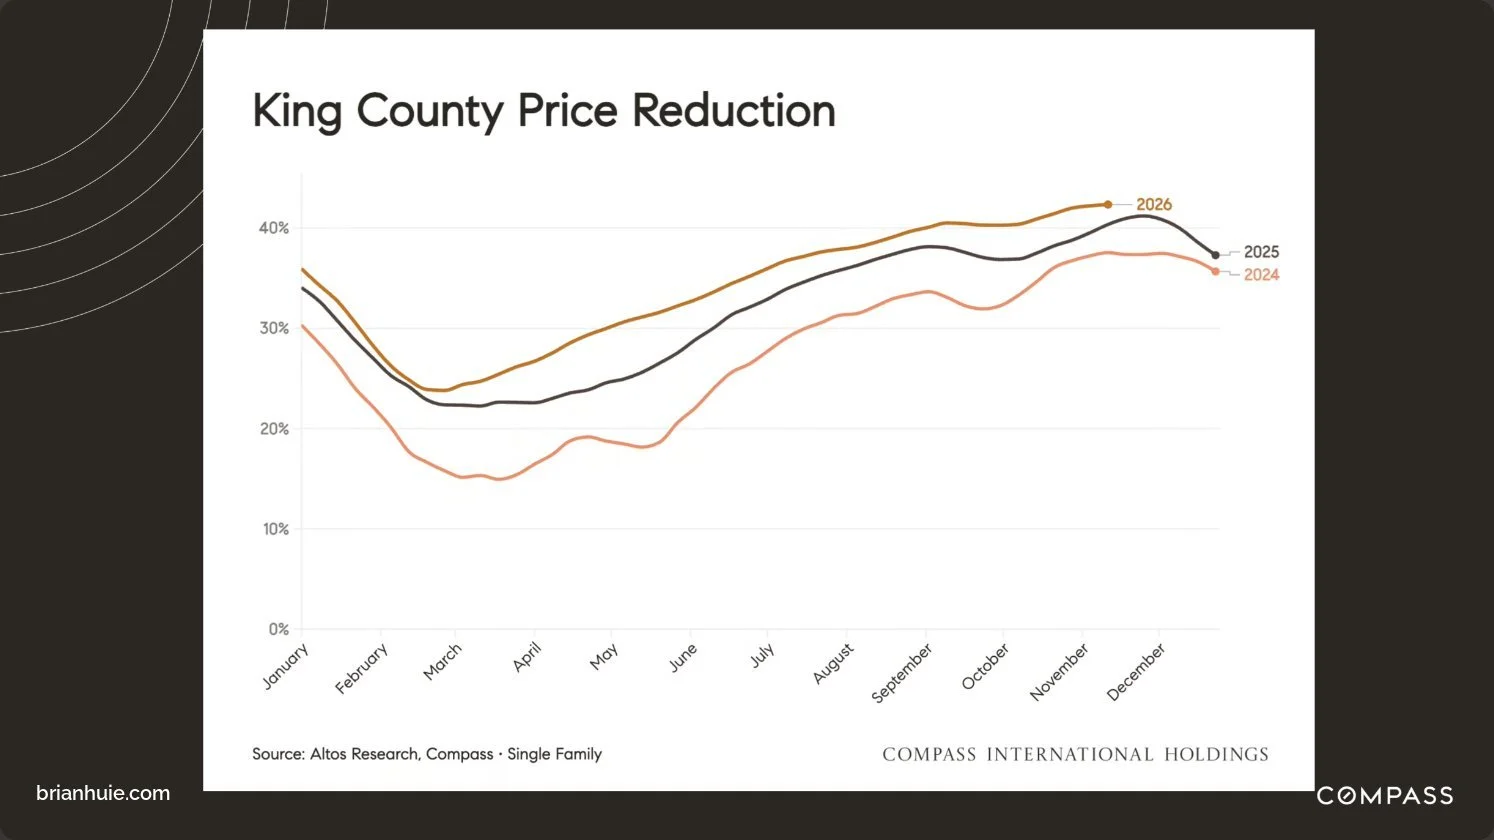
Slide imageKing County | Price reductionsAbout 42% of King County listings have reduced their asking price, 2024 to 2026 (Altos Research via Compass)
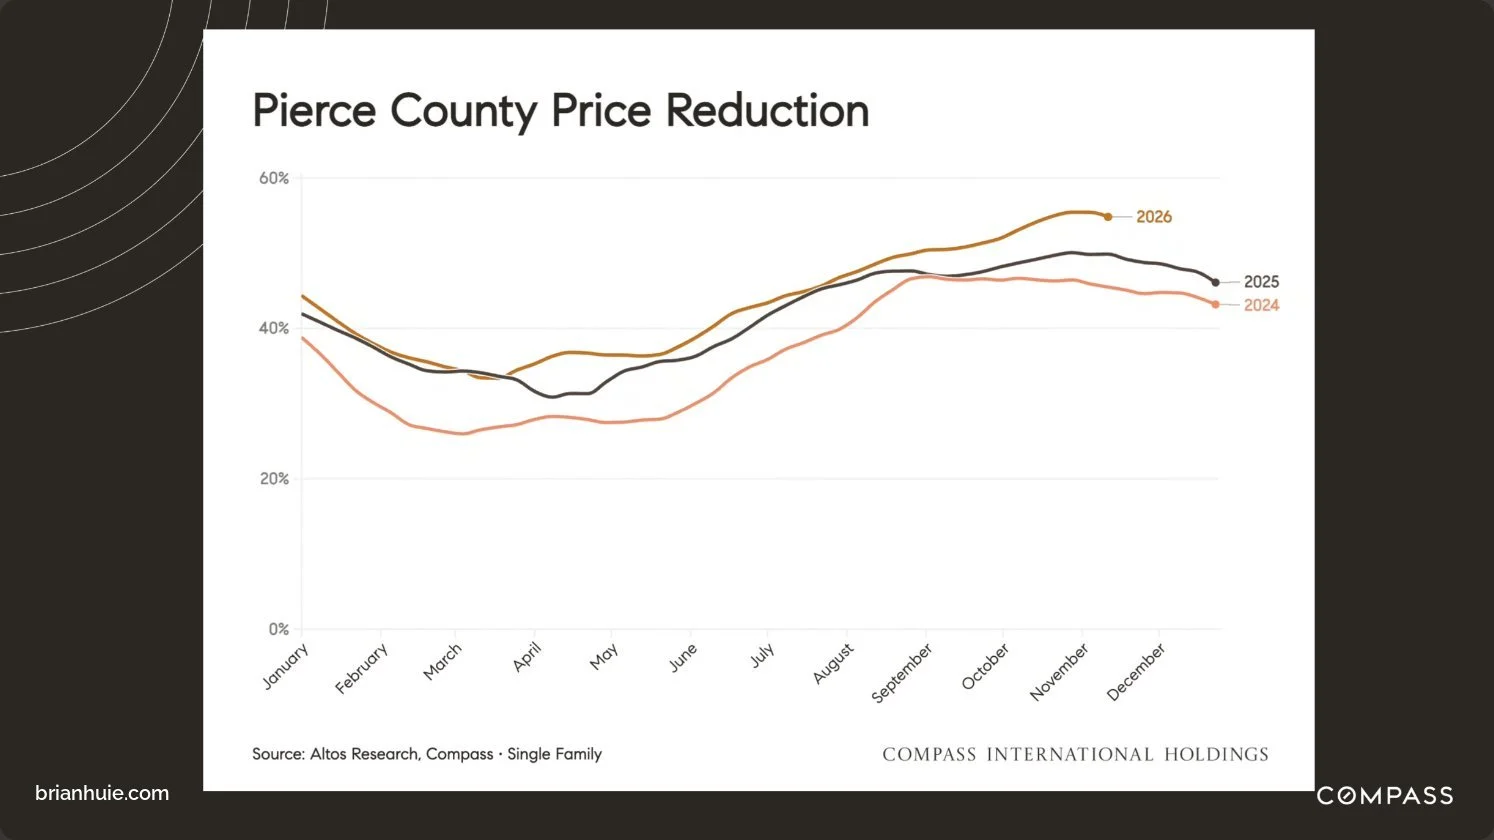
Slide imagePierce County | Price reductionsAbout 55% of Pierce County listings have reduced their asking price, 2024 to 2026 (Altos Research via Compass)
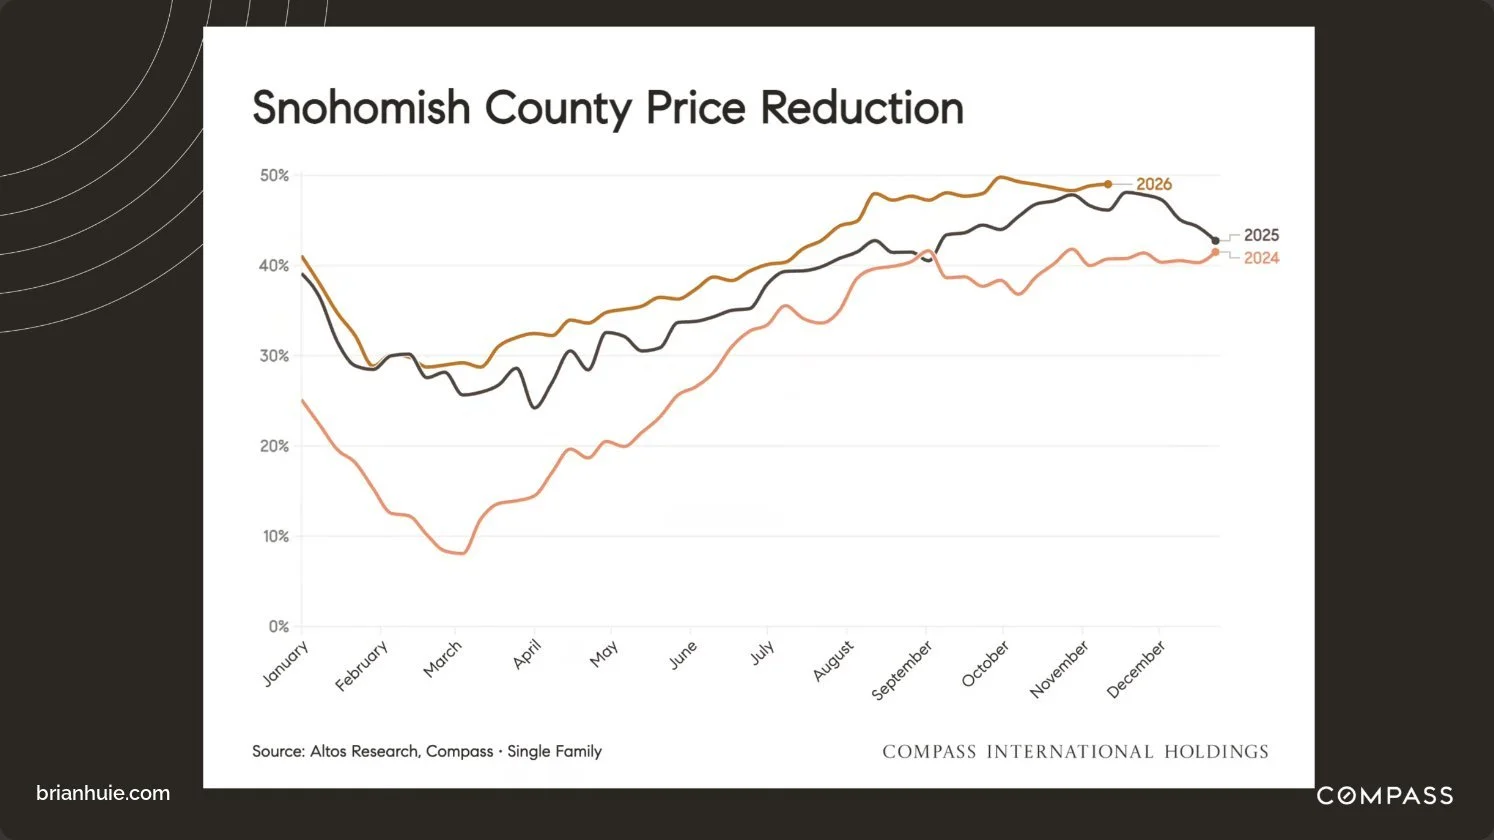
Slide imageSnohomish County | Price reductionsNearly half of Snohomish County listings have reduced their asking price, 2024 to 2026 (Altos Research via Compass)
Slide imageKing County | RelistsSellers returning for another try, 2024 to 2026 (Altos Research via Compass)
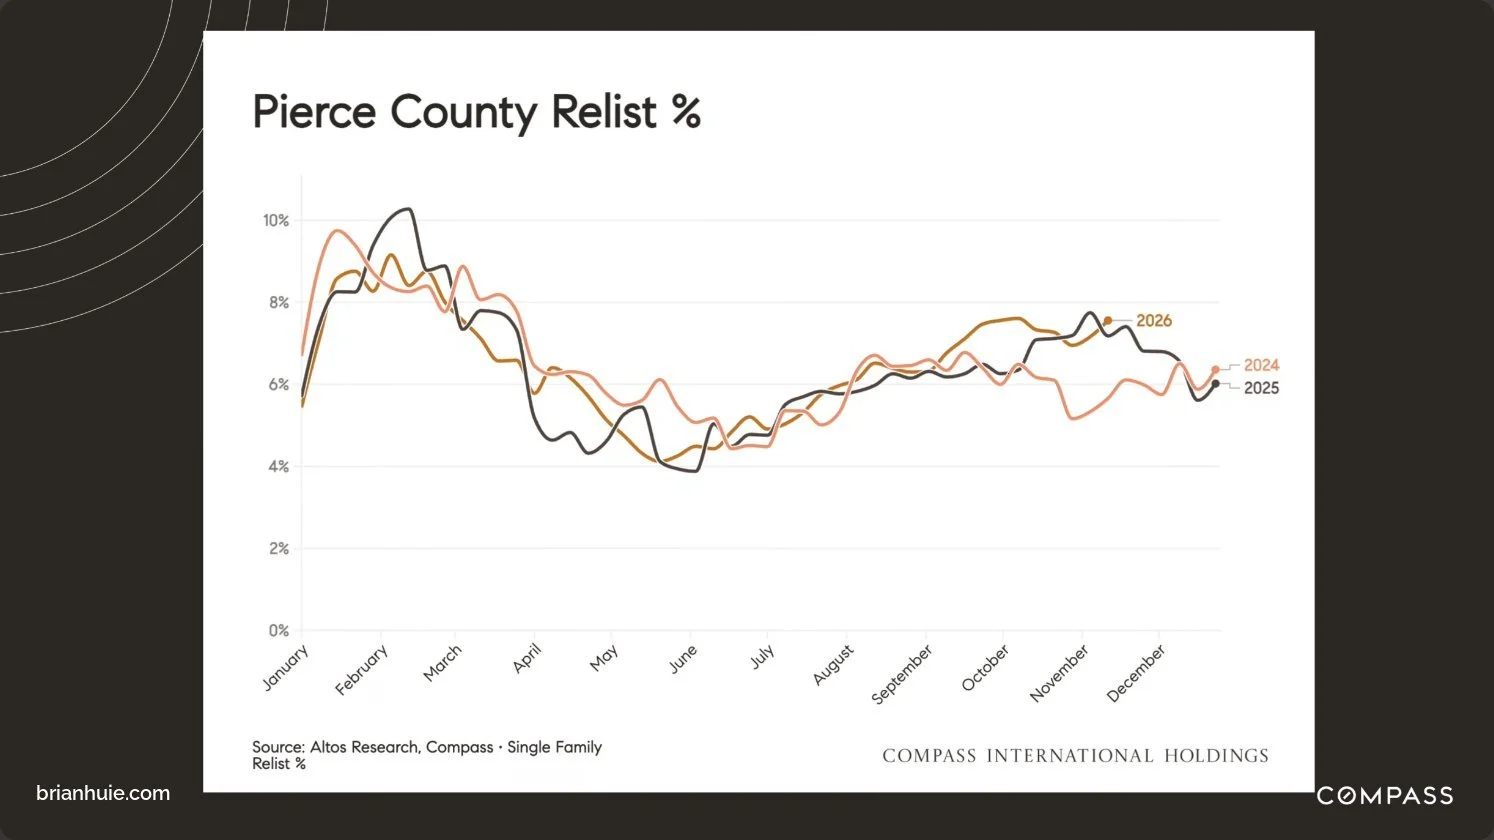
Slide imagePierce County | RelistsSellers returning for another try, 2024 to 2026 (Altos Research via Compass)
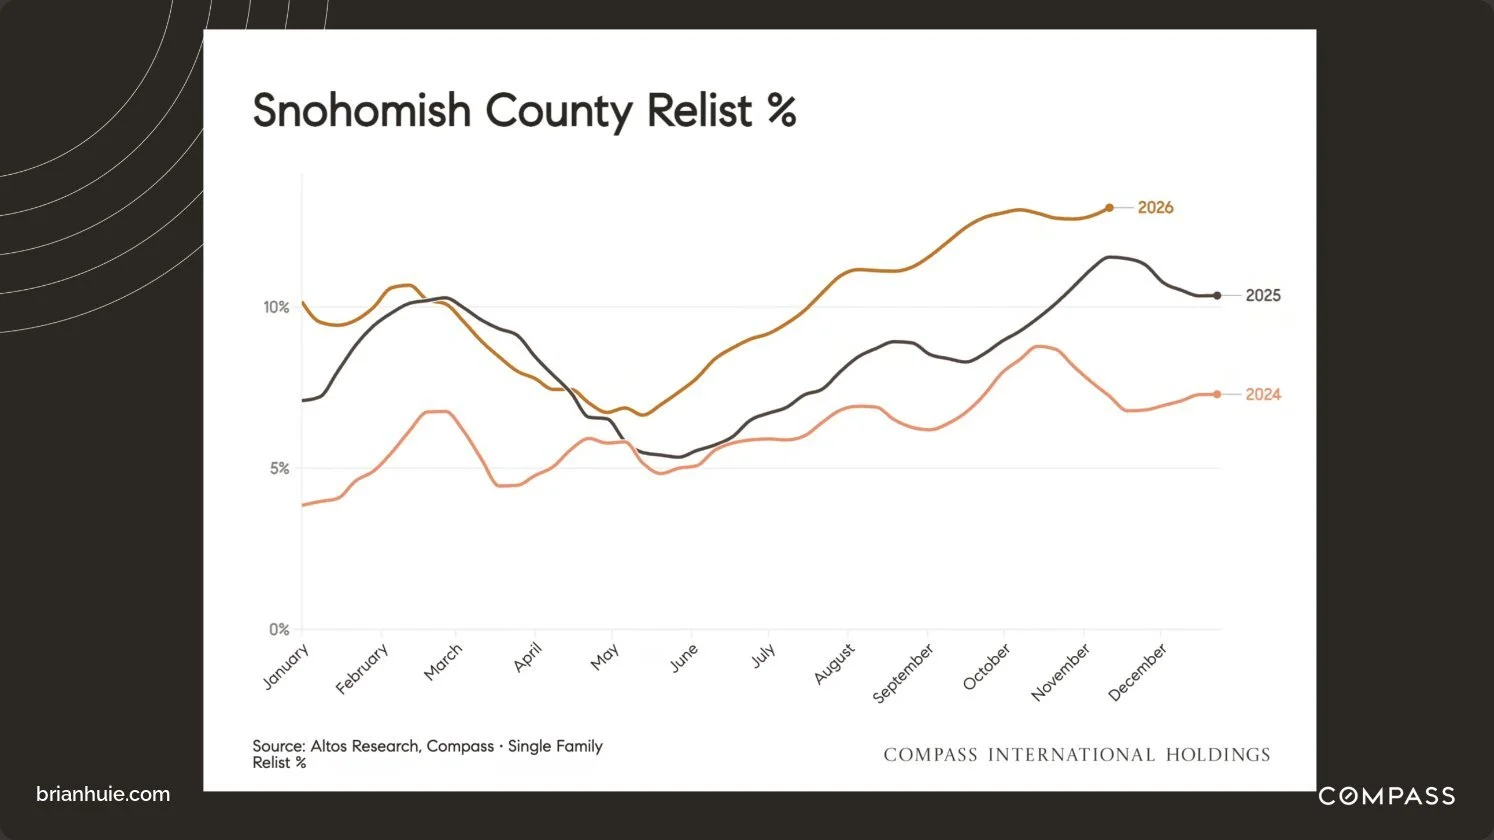
Slide imageSnohomish County | RelistsSellers returning for another try, 2024 to 2026 (Altos Research via Compass)
1 of 15
King County, Nov 8 to 14. 7,205 for sale (down 4.0%), 418 new listings (down 31.6%), 392 pending (up 12.3%) and 262 sold (down 21.6%).
Seattle. Pendings rose 13.4% to 144 while new listings fell 31.8% to 180. Closings fell 15.6% to 108, and inventory eased to 2,800, the lowest in this 15-week view.
Eastside. New listings fell 40.6% to 114, the steepest drop of any area, and inventory fell to 2,291. Pendings slipped 4.3% to 110 and closings fell 29.6% to 76.
Snohomish County. Pendings rose 2.2% to 141 while new listings fell 18.1% to 163. Closings fell 7.0% to 93.
Pierce County. Pendings fell 13.8% to 162, the largest drop of any area. New listings fell 20.2% to 162 and closings fell 15.5% to 120.
King County, November so far. Compared with the same point in October, 9.8% fewer homes for sale, 30.5% fewer closed sales and 6.2% fewer pendings.
Snohomish County, November so far. 8.1% fewer homes for sale, 38.1% fewer closed sales and 4.3% fewer pendings than at the same point in October.
Pierce County, November so far. 7.2% fewer homes for sale, 24.7% fewer closed sales and 5.6% fewer pendings than at the same point in October.
Last week by area. King County days on market rose to 48, from 41 the week before. In Seattle the median sale price ($790K) was above the median active price ($749K); on the Eastside it was below ($1.239M vs. $1.300M).
King County price cuts. About 42% of listings have cut their asking price, above the same point in 2024 and 2025, and the 2026 line is still rising.
Pierce County price cuts. About 55% of listings have cut their asking price, above 2024 and 2025, though the 2026 line has started to level off.
Snohomish County price cuts. Nearly half of listings have cut their asking price, close to 2025 at this point in the year and above 2024.
King County relists. Relists are still climbing into November, near 19% of listings, while in 2024 and 2025 they fell at this point in the year.
Pierce County relists. Relists picked up again in November and are running slightly above 2024 and 2025.
Snohomish County relists. Relists keep rising and have run above 2024 and 2025 since late spring.
Slides: Compass Pacific Northwest weekly market report (Compass-PNW.com), MLS and Altos Research data, from the November 16, 2026 meeting. Preliminary, not yet verified by NWMLS.
Common questions
How does the Seattle housing market compare with the 10-year average?
It is slower. In October 2026, every Seattle and Eastside segment had more months of supply, a lower sale-to-list ratio and longer days on market than its 10-year October average. Seattle condos had 9.8 months of supply against an average of 3.6.
What is a normal sale-to-list ratio in Seattle?
For October over the last 10 years, Seattle houses averaged 101.2% of list price, townhomes 99.8% and condos 99.3%. In October 2026 they sold at 99.6%, 98.9% and 97.2%. These use the final list price; canceled and relisted history is not counted.
Is the Seattle housing market slowing down?
Yes, compared with a year ago. King County had 7,726 homes for sale in October 2026, 28.7% more than October 2025, while closed sales fell 22.2% and pending sales fell 7.0% (preliminary Compass figures). Homes are still selling, but buyers have more choice and more room to negotiate.
Is Seattle a buyer’s market right now?
It leans toward buyers. In October 2026, 22.7% of King County homes for sale went pending, down from 31.4% a year earlier, and in October every Seattle and Eastside segment sold slower and for a lower share of list price than its 10-year October average.
Are Seattle-area homes selling over asking price?
Not typically. As of November 9, 2026, King County houses and townhomes were going pending at an average of 98% of list price, and condos at 97%. About 19% of house and townhome pendings had multiple offers, and about 9% of condo pendings.
What is the average mortgage rate right now?
As of November 12, 2026, the U.S. average 30-year fixed mortgage rate was 7.11%, down from 7.18% the week before and 6.24% a year earlier, according to Freddie Mac's weekly survey. The 15-year fixed averaged 6.45%. The rate on a specific loan depends on credit, down payment and loan type.
How many homes go pending each week in Seattle?
For the week of November 8 to 14, 2026, 144 Seattle homes went pending, 13.4% more than the week before. King County had 392 new pendings, up 12.3%, and the Eastside had 110, down 4.3%.
What is a pending home sale?
A pending sale is a home with an accepted offer that has not closed yet. Because the agreed price is not published until closing, pending data is the earliest read on what buyers are paying. Closings usually follow pendings by about 9 to 25 days.
What is an escalation clause?
An escalation clause automatically raises a buyer's offer by a set amount over competing offers, up to a cap. Only 4% of King County house pendings and 2% of condo pendings used one as of November 9, 2026.
How long does it take to sell a house in Seattle?
Seattle houses that sold in October 2026 averaged 23 days on market, against a 10-year October average of 20. Townhomes averaged 35 days and condos 50.
What does months of supply mean?
Months of supply is how many months the homes for sale would last at that month's pace of closed sales if no new listings came on. Lower means more competition among buyers; higher means more choice.
What is a First Look listing on NWMLS?
First Look is a newer NWMLS status that lets a home be marketed for up to 21 days before it becomes an active listing, without building days on market or a public price history. Brokers report mixed results so far, and many buyers are still unsure what it means.
When is the best month to sell a home in Seattle?
Over the last 10 years, April. Seattle houses averaged 105.8% of list price in April, townhomes 101.7% and condos 101.3%.
How often is this Seattle market update refreshed?
Weekly numbers, pending data, broker notes and the mortgage rate are updated every week. The 10-year comparison is updated monthly, once NWMLS posts the prior month’s data.